Challenge
The client was a poker coach, helping serious players improve by thoroughly analyzing their hand histories.
Students provided their raw hand data, which the client ran through a proprietary tool. The resulting analysis was then pulled into a clunky ~20 MB+ Excel file, which used data validation and VBA to create a set of interactive summary tables and charts.
However, this Excel file wasn’t a viable long-term solution:
- The proprietary tool’s analysis output should not be shared with the student; they should only be able to view the summary tables/charts
- The generation of the summary data was error-prone and inflexible
- The client could screen-share the Excel file during a lesson, but the student would have no way to go back and review their stats on their own
Solution
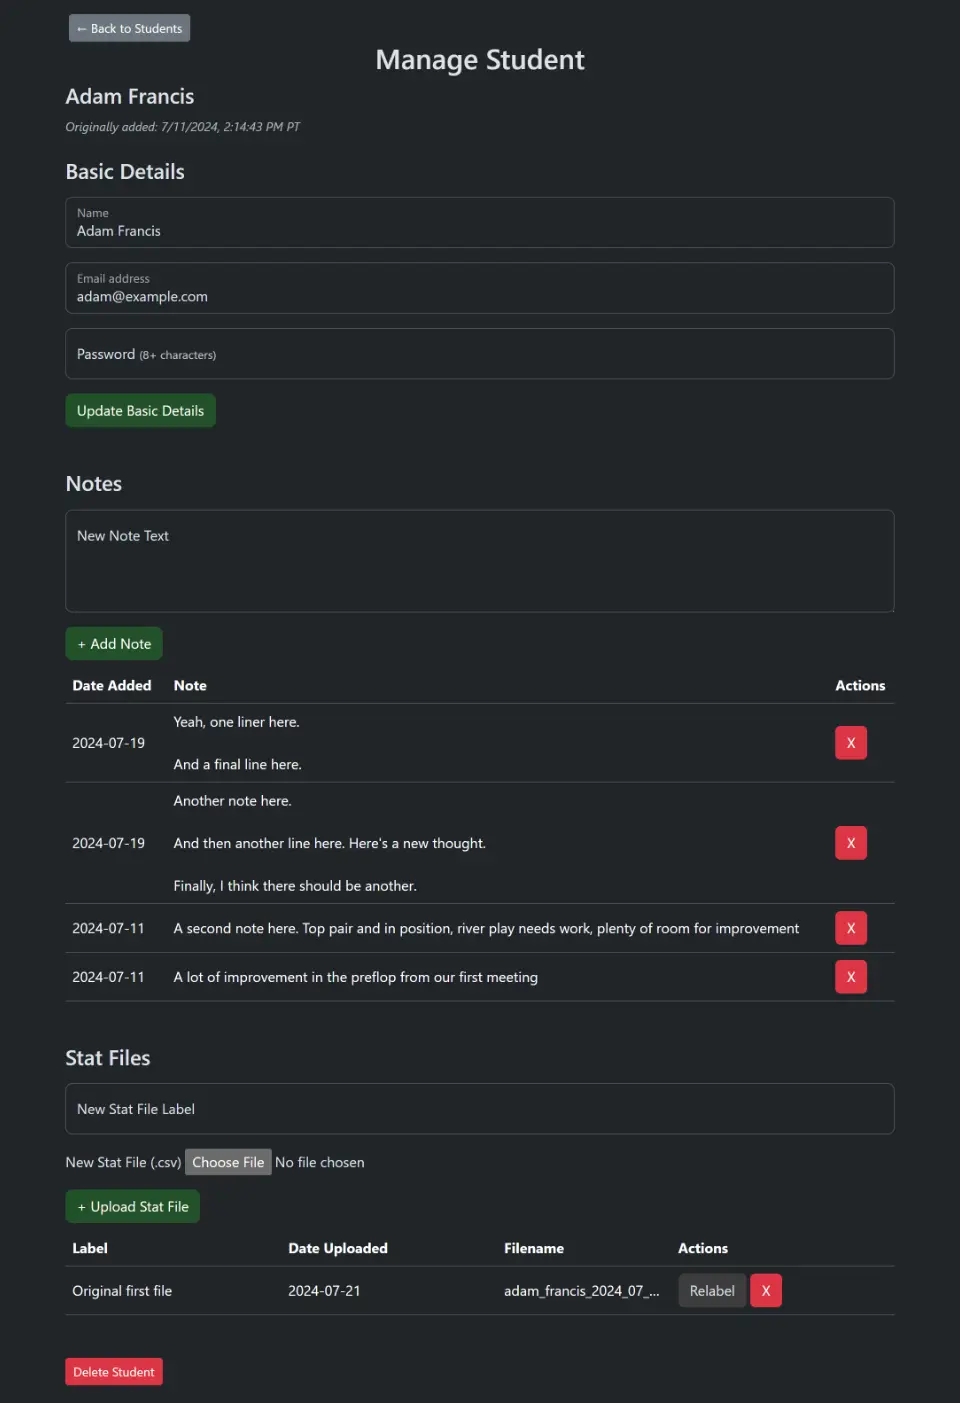
This was a perfect case for a full-stack web app. Admins can manage students; students can log in and view extremely detailed analyses of their hands.
I iterated on the design with the client to ensure that the UX was in line with their vision: an all-in-one platform for their coaching. On top of the statistics viewing, for example, a coach could also store text notes (e.g., to track students’ progress over time).

Ultimately, the flow went like this:
- Coach crunches the student’s numbers into a .csv file (offline)
- Coach creates an account for the student
- Coach uploads the .csv file into the student record
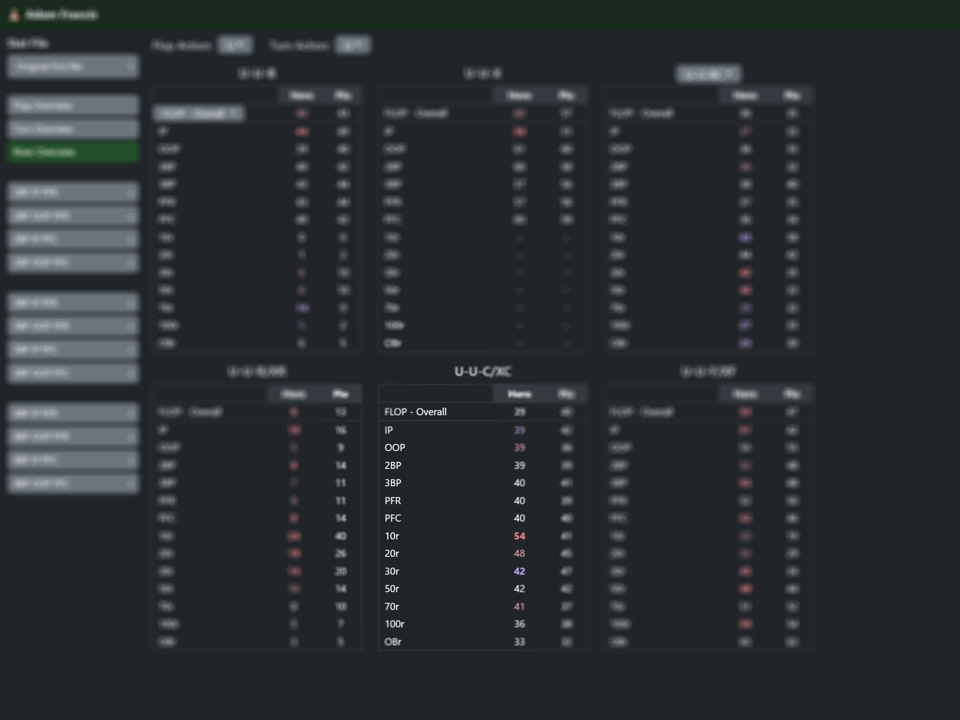
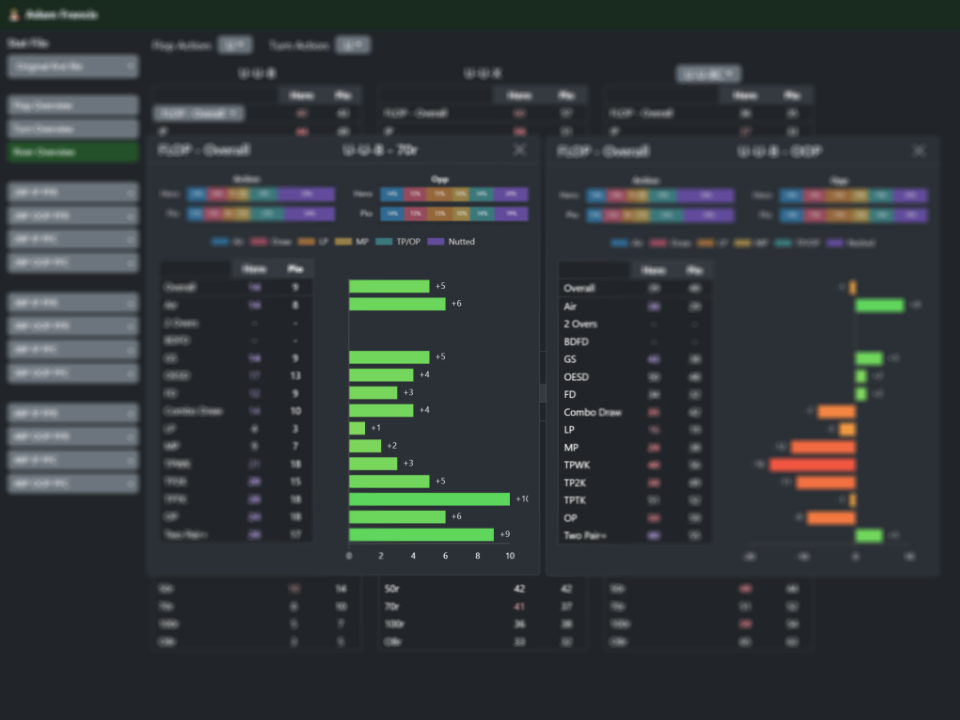
- Student can log in and see their summary tables/charts
Certain parameters were also made dynamic (e.g., so the coach could modify specific hand contexts/situations in the future), with an option to restore them to “factory defaults.”
Outcome

The client now has a convenient, robust platform where they can compare/contrast various aspects of any student’s performance. Students themselves can click around on their own time to review areas of improvement.
Plus, there’s an opportunity to share this solution with other coaches who utilize a similar toolset.

